Maps Hub Overview
 Updated
by
Janelle Heuton
Updated
by
Janelle Heuton
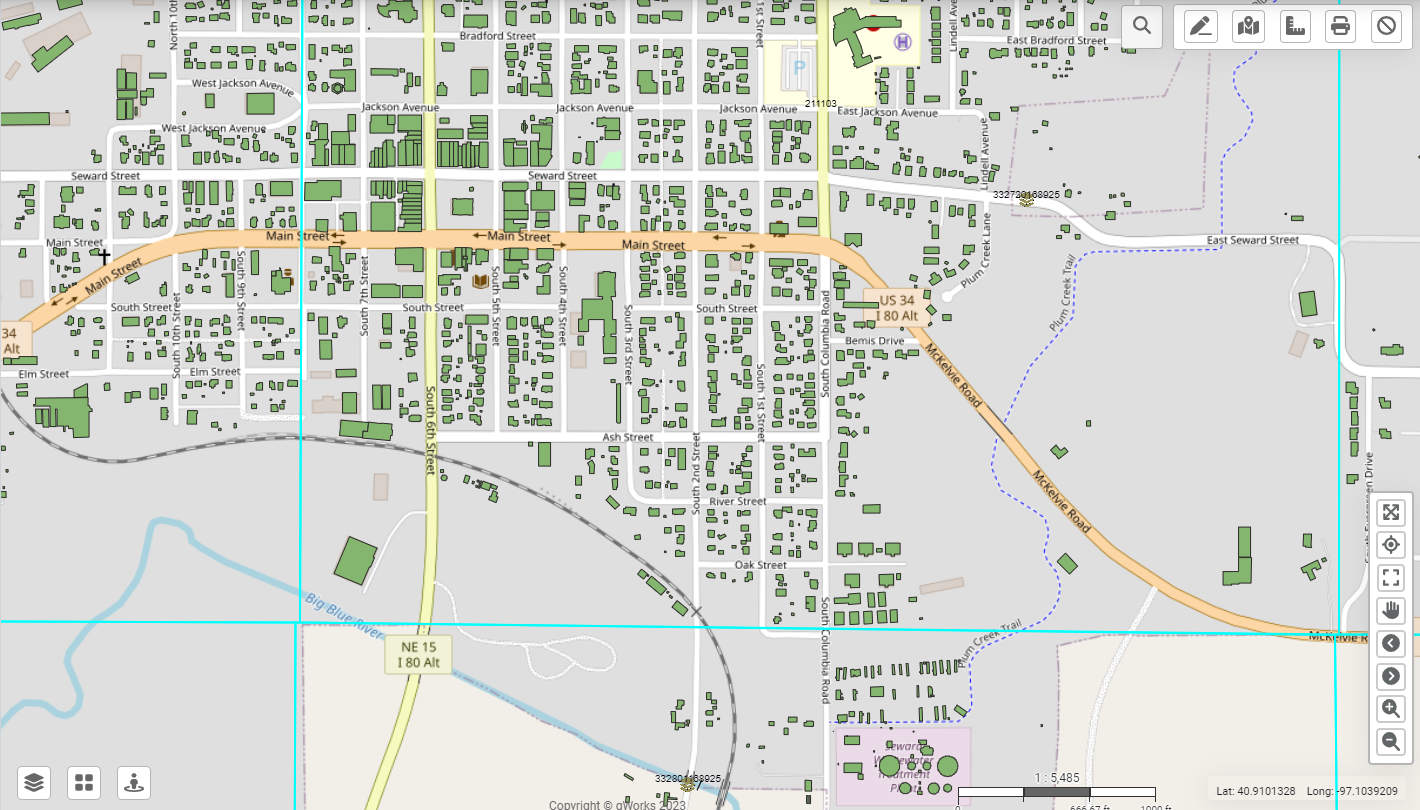
Maps Hub is designed to help you visualize your Agency's assets in an interactive spatial context. Maps Hub includes the Map Viewer, Tools for viewing and interacting with the data, and Results window that displays details of any assets you have selected.
While you can use the mapping interface to interact with the data on the Map, some functions, such as adding new layers and updating symbology, will actually be done through the Operations ("Ops") Hub.
Common Terms
Maps Hub includes Assets, Attributes, and Layers.
- Asset: An asset is a physical item associated with a location, like a fire hydrant or property location. Maps Hub allows you to visualize each asset's location, view its relationship with other assets, and analyze or interpret patterns and trends.
- Asset Type: An Asset Type is a specific category of asset, like Main Lines or Curb Stops. All individual asset types are grouped under Asset Types.
- Attribute: An attribute is a characteristic or property of an asset. This data is stored in a table and can vary by Asset Type.
- Layer: Layers are collections of geographic data displayed on a map. A layer usually represents an Asset Type, such as fire hydrants, and contains all individual assets of that type.
Layers & Basemaps
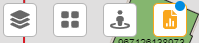
In the bottom left corner of the Map, you can find the Layers Menu, Basemaps Menu, and Google Streetview.
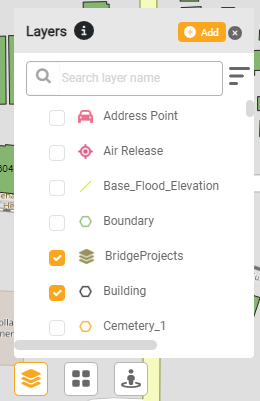
Layers Menu
Layers contain all Asset Types available for view. Use the Layers Menu to toggle individual layers on or off. Check the box next to each layer you want to display.
Use the Search Bar at the top to find a specific layer.
You can right-click any layer for more options, such as Zoom to Layer, Update Symbology, Move Up, Move Down, or to change the layer's opacity.
Click the three horizontal lines next to the Search Bar to toggle all layers on or off, collapse all layers, expand all layers, or change the opacity of all layers.
Click "Add" to create a new layer, which will direct you to Ops Hub for management.
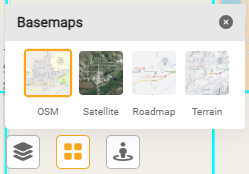
Basemaps
Use the Basemaps Menu to select different basemap options. With Satellite imagery, you can toggle labels on or off.
Streetview
Use streetview to open Google Streetview for a specific area. Click on the Google Streetview icon. This will turn your cursor into a person. Move the person to a specific location on the map and click with your mouse. This will open Google Streetview for that location in a new window.

Maps Hub Tools
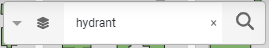
Search
You can search for a Specific Asset or Assets that meet specific criteria using the Search Tool. First, select what you are searching for: Address, Owner Name, Parcel Identification Number ("PID"), Section/Township/Range ("STR"), GIS Layer, or All.
Enter your search term and click the Magnifying Glass. All matching results will populate the Results table.
Draw & Measure
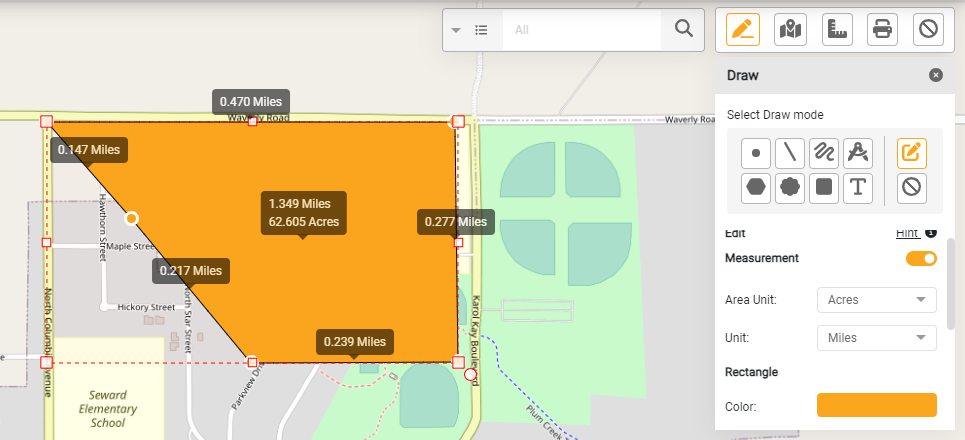
Use the Draw and Measure Tool to draw and annotate points, lines, and shapes directly on the map.
- Click the Draw and Measure Tool and select your Draw Mode: point, line, freehand line, circle, polygon, freehand polygon, rectangle, or text.
- You can turn measurements on or off by clicking the Measurement toggle. When the Measurement Toggle is on, you can select the units you wish to use for measuring.
- Select from the available options to change the color, style, width, and font of your drawing.
- Click on the map to begin drawing. You can draw as many shapes on the map as needed.
- If you wish to edit an individual drawing, click the Edit button within the Draw tool. Select the shape you wish to edit. You can then change the size, shape, color, style, or width of that drawing.
- If you wish to remove an individual drawing, click the Clear button within the Draw Tool. You can select the individual drawing you wish to remove and then click Clear. If you wish to clear out all drawings, click Clear all.
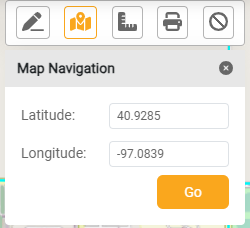
Map Navigation
Use the Map Navigation to zoom into a specific Latitude and Longitude. Enter the coordinates for Latitude and Longitude in the text box and click Go to zoom in to that location.
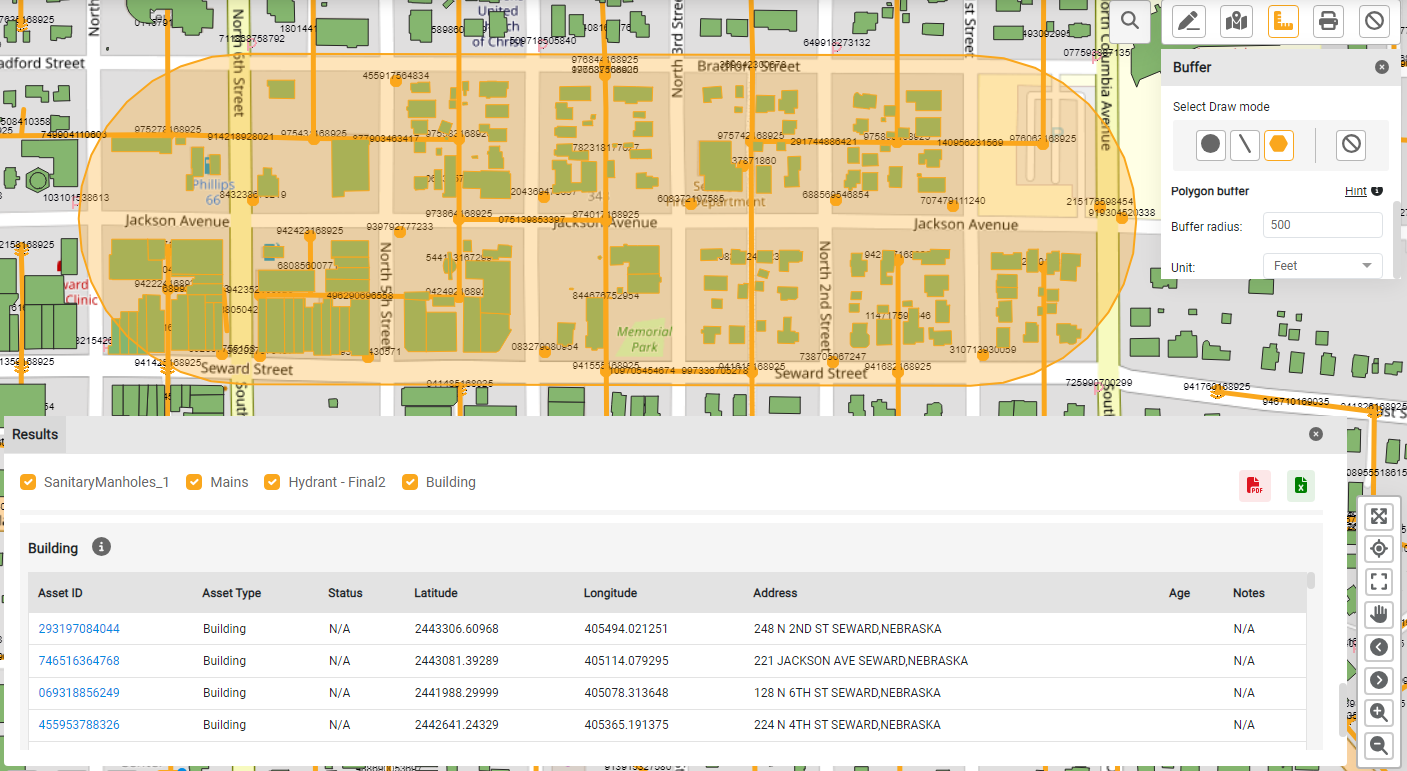
Buffer
Use the Buffer Tool to draw a buffer zone of a point or path and select all Assets that fall within a specific radius. This tool can be used to find all Assets that might be affected by an event.
- Click the Buffer Tool and select the draw mode: point, line, or polygon.
- Enter the Buffer Radius and Unit. The Buffer Radius will determine the distance from the point, line, or polygon you draw on the map. The Buffer Tool will select everything within this radius.
- Click on the map to add your point, line, or polygon. If you are drawing a line or a polygon, double-click to end the drawing.
- The Results table will display all Assets that are currently turned on in the Layers Menu that fall within the Buffer Radius.
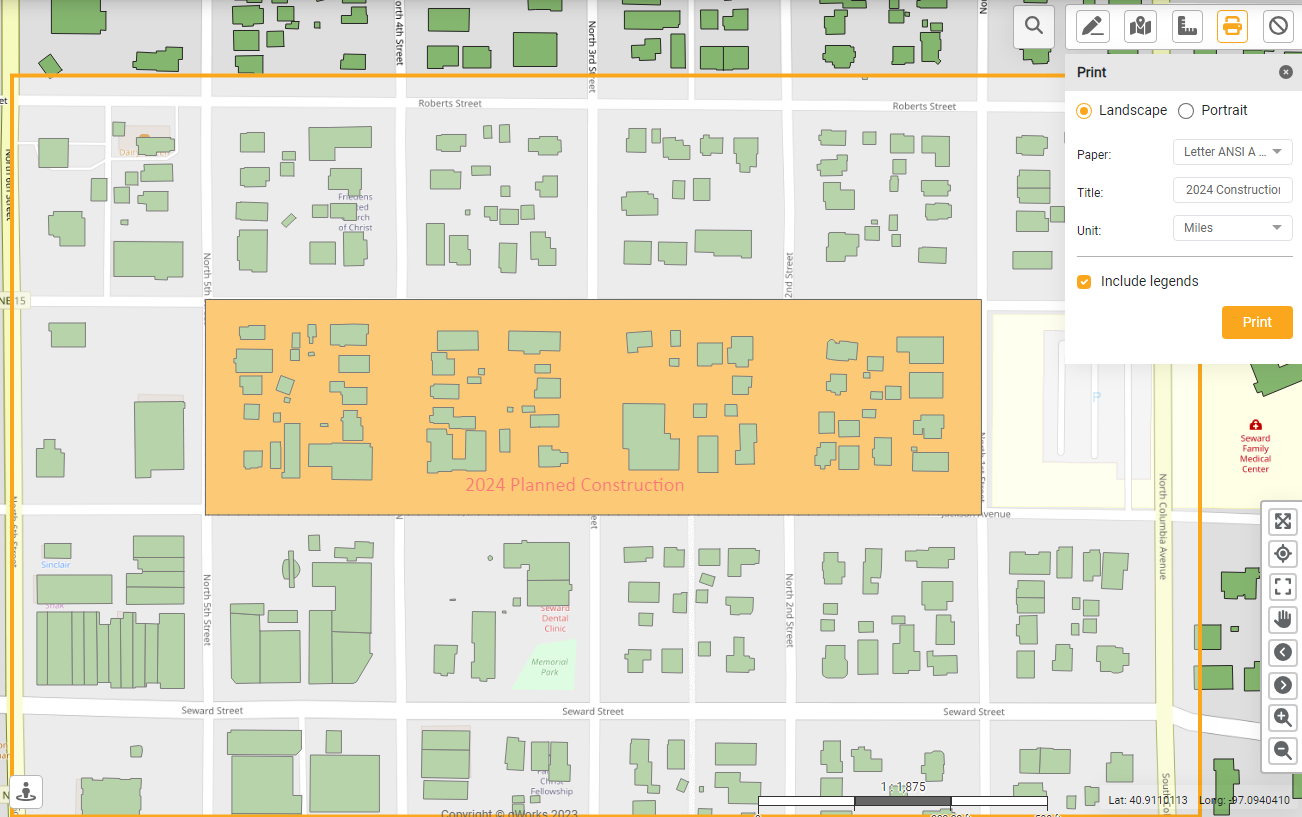
Use the Print Tool to create a PDF of the current view of the map so you can save or print the PDF.
- Click the Print Tool. This will open an orange rectangle on the screen. This rectangle represents your print area, so the PDF will include everything within this area exactly as you see it on the screen.
- You can change the print area by choose Landscape or Portrait Mode, selecting a Paper Size, and using the pan tool to drag the print area within the rectangle.
- Enter a Title and select a unit for the legend on the map. Choose whether to include legends with the toggle.
- Click Print to create the PDF with the settings you have selected. The PDF will include the layers, imagery, and annotations included in that map view.
Clear
Use the Clear button to clear the map of any existing tools, drawings, measurements, and search results. This will close all open tools and refresh the map to its natural state.
Map Navigation
In the bottom right-hand corner of Maps Hub you can find the Navigation Tools for moving around the map.
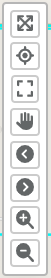
- Full Extent. Use the Full Extent to zoom all the way out to the
- Current Location. Use the Current Location to zoom to your current location based on your device.
- Full Screen. Use Full Screen to expand the Map so it covers the entire screen of your device. Click the icon again or press Escape to return to the normal view.
- Pan. Use Pan to click on the map and drag it to change your map view.
- Previous. Use Previous to go back to your previous map extent or zoom level.
- Next. Use Next to go back to your current map extent or zoom level.
- Zoom In. Use Zoom In to zoom into the map.
- Zoom Out. Use Zoom Out to zoom out of the map.
Interacting with Data through the Results Table
Maps Hub will display all Layers currently turned on in the Layers Menu. You can turn Layers on or off by selecting the Layers Menu and checking the box next to the items you wish you display.
You can interact with Maps Hub to view the Attributes of any Layer or individual Asset. You can interact with Assets on the Map by clicking an Asset or using the Search Tool.
Select an Asset from the Map
You can interact with the Assets in the Map view to view additional information, or Attributes, about a specific Asset or subset of Assets. Attributes for the selected Assets will appear in the Results table. You can select an Asset by using the Search Bar to search for all Assets that match your search criteria. Alternatively, you can select any Asset directly from the map.
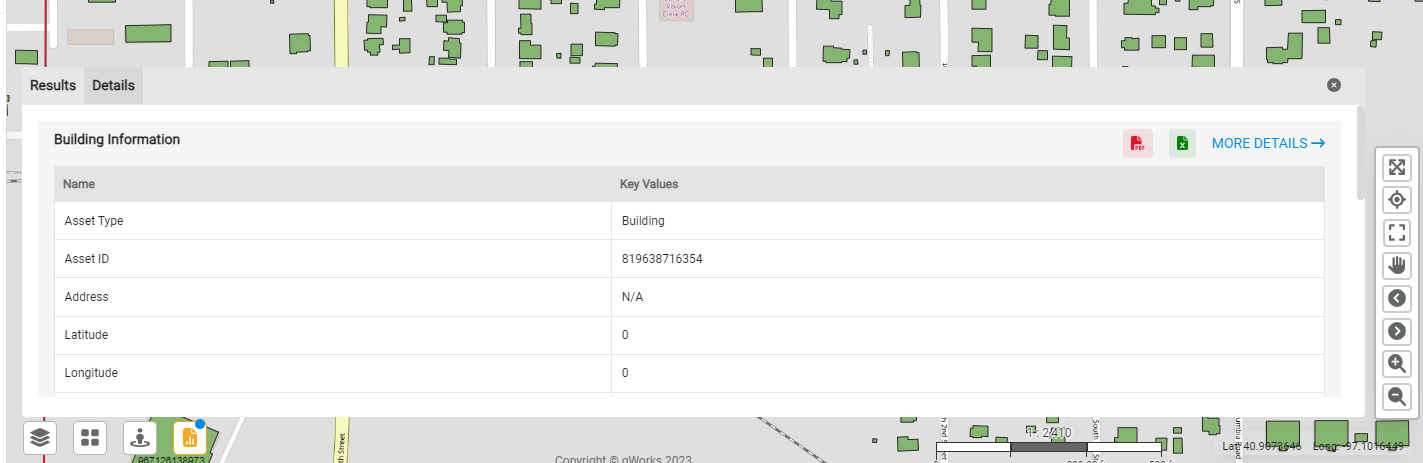
To select any Asset and view details about that Asset, click the item you wish to view on the Map. Because GIS Layers sit on top of each other, this will open a Results table that displays all the individual Assets across all the Asset Types you clicked on the Map. To remove an Asset Type from the export, you can uncheck the box to remove it from the Results Tab. You can download the entire contents of the Results table by clicking the PDF or Excel icons.
To view the details of any individual Asset, select that Asset from the Results table. This will display the specific Attributes of the individual Asset you have selected.
You can go back to the Results Menu at any time by selecting the Results Tab.
Once Results are displayed, the Results Icon will appear. You can hide the Results table any time by clicking on the Results icon. It will turn grey to indicate the Results are no longer active. The blue dot indicates the Results table is populated with data and can be re-opened at any time.
For more information about how to manage your Maps Hub data, read Managing Your Maps Hub Data.